I think cholesterol data was starting to be gathered 15 years ago. My own data starts at 1989. The importance of having baseline data over several years is shown by examining the Framingham Risk Factor tables. The risk varies appreciably with age, that is, over the years for a given individual. Here is a copy of the Framingham table for men that presents the assigned points measuring the risk of having a coronary artery disease (CAD) event in a 10 year interval for total cholesterol groups and age groups.
See:
"Third Report of the Expert Panel on Detection, Evaluation, and Treatment
of High Blood Cholesterol in Adults (Adult Treatment Panel III)"
"National Cholesterol Education Program"

To tease the factor that the Framingham Study finds for expected, benign, increase in total cholesterol increase with age, one follows on one of the diagonals of the table the equal risk factors entries. For example, the first diagonal, 0 4 5 4 3. I ignore the zero that comes from the totally risk free reading, <160. The total cholesterol interval is 280-160=120 mg/dL for an age span of 79-20=59 years. In that extreme the table says one is at constant risk for CAD with an increase of total cholesterol of 120 mg/dL over an age increase of 59 years. To determine a representative allowed increase in total cholesterol per year I use the median value of each group; for total cholesterol, 180 220 260 290?, and I interpolate the ages for a risk factor of 4, say, 30 49 55 60. Using the first 3 values I have a change of 80 mg/L in 25 years, or 3.2 mg/dL increase per year. I find a value of 3.2 mg/dL to be representative of the message delivered by the table, and I will use it in the following discussion. As a matter of fact, the actual value one chooses is not as important as the fact that it is not zero; age does have its benefits!
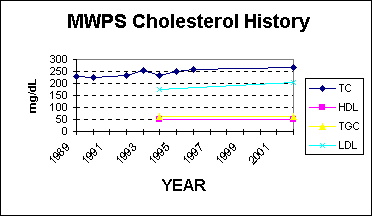
If I plot my own data taken in years past I have a chart as follows:

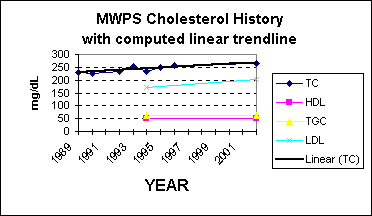
If I fit a linear trend line to the total cholesterol data I have:

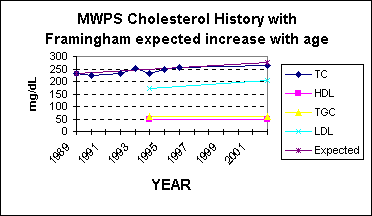
The slope of the trendline is 2.8 mg/dL, essentially the same variation allowed by the Framingham CAD Study. A chart using the slope, 3.2 mg/dL, that the Framingham Study allows is as follows:

So my historical measurements of my total cholesterol tell me that my rise in total cholesterol is consistent with the expectations imbedded in the Framingham Study table for men, and I am given a risk point amount of 1 from the table.
The Framingham Study table for women is similar, with the same message. The expected increase in total cholesterol I determine from their table is slightly higher than the increase for men. For women the increase seems to be about 3.7 mg/dL for age less than 60, and higher than that for older women.
The other tables assembled from the Framingham Study are those for smoking, HDL, and systolic blood pressure. Diabetics receive extra risk points; I am not diabetic. Exercise earns a negative risk point. As a non-smoker I have zero added risk points from that, and zero points from my blood pressure. My HDL, appears to be independent of my age, and of a value that merits 1 risk point. I could say that my -1 point for exercise cancels out my +1 point for my HDL, leaving me with zero risk point. It matters not if my total is zero or 1, for the 10-year risk table exhibits a 1 percent risk of CAD for point totals of 4 or less. As far as I am concerned that probability is certainly much larger than the probability of winning the lottery, but it is small enough to make me not want to turn to chemical treatments. But wait, there is more to consider.
A recent study comparing the C-reactive protein and low density lipoprotein (LDL) as markers for cardiovascular events, or CAD, has been published recently in the Journal of the New England Medical Society:
A final word about risks. Later risk tables modify the points associated with the several parameters considered. See, for example:
Given the tenuous understanding of how or why these factors are correlated with CAD, one is bordering on the fatuous to trust the size of the risk points to within a few points, or the 10-year risk within several percentage points. What is not needed is a more precise set of these numbers, for they are imprecise by their nature, but what is needed is the discovery of other protein indicators which have densities correlated to CAD and weakly correlated to C-reactive protein and LDL or total cholesterol density. Beyond the protein monitors, or blood test monitors -- would they be called occult monitors? -- there are the other factors, smoking habit, blood pressure, diabetes, obesity, exercise regimen, which can be observed non-invasively and which contribute risk information. Are there others? Personality type, stress endured?FINAL DECISION: Stay the course, no statin treatment.


Framingham 10-Year Risk by Total Framingham Point Scores
